Edward Swing
National Security Agency
My colleagues and I at the National Security Agency designed an application called Flodar (short for Flow Radar) that monitors the flow of network traffic. The techniques and visuals used in Flodar can apply to a variety of applications. While many flow visualizations concentrate on the path of the network traffic, this system is designed to monitor the status of individual servers within the system.
In our particular system, we need to monitor two types of servers; those that send information at semi-regular intervals, and those that receive this information and store it temporarily, waiting for the information to be read or processed by users within a certain time. We are not as concerned with the path the data takes to get from Sending Server to Storage Server. We are more concerned with ensuring the Sender is transmitting regularly, and that the information on the Storage Server is processed before being overwritten. Therefore, monitoring system's timeliness remains the primary objective for FLODAR.
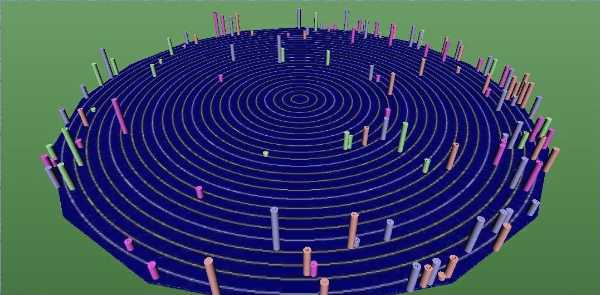
We designed the visualization in the Flodar system to draw the (human) traffic monitor's eye toward the data's important features. Figure 1 shows the "platter", the primary display. Here you see a number of servers, each represented by a cylinder, arranged radially around a disc. Rings on the disc provide a time reference - each ring represents an hour of time; Figure 1 represents one entire 24-hour period. When a server signals (either transmitting data in the case of the Sending Servers, or indicating that its stored records have been checked in the case of the Storage Servers), the system places a cylinder on the outermost ring, which represents current time. As time passes, the cylinders slowly move in toward the center. Those approaching the center have not signalled recently - they are the ones which need to be closely observed or examined for problems.
Figure 1: Flodar Platter Display
This visualization has a straightforward design. By using the center for the servers which are in trouble, the platter draws the traffic monitor's eye toward the center like a bulls-eye on a target. Each cylinder's height represents the volume of traffic from that server, so that someone monitoring the systems can easily detect those carrying more traffic (and therefore more important). Color is used to segregate the servers according to various categories. Because of the radial arrangement of the servers, the FLODAR display can easily represent several hundred servers at a time without confusion.
Experiments with the platter show that the traffic monitors easily learn the visualization, and are quite comfortable with it. They are able to quickly notice when a server is not behaving within normal constraints, simply by glancing at the display. Any Server which deviates from its regular transmission interval will be apparent from the visual display, since the traffic monitor will see the representative cylinder migrating in toward the center. We are currently experimenting with a version of the Platter which uses expected reporting times and standard deviations to indicate status instead of time.
The Flodar system also has two alternate visualizations. The first, a geographic view seen in Figure 2, shows the remote servers by their locations on earth. In this representation, each server is represented by a small sphere tethered to its location. The tether's length represents the time from the last signal. This gives a 'pin-cushion' representation. As time advances, the tethers lengthen and the spheres gain in altitude. The traffic monitor's eye gravitates to the objects at a higher altitude; spinning the globe provides a viewpoint from any angle, while the various tether directions help to distinguish one server from another. The spheres at the ends of the tethers also gradually change color based upon the time since the last signal, while the tethers themselves are color-coded by the same coloring scheme (by category) used for the cylinders on the platter.
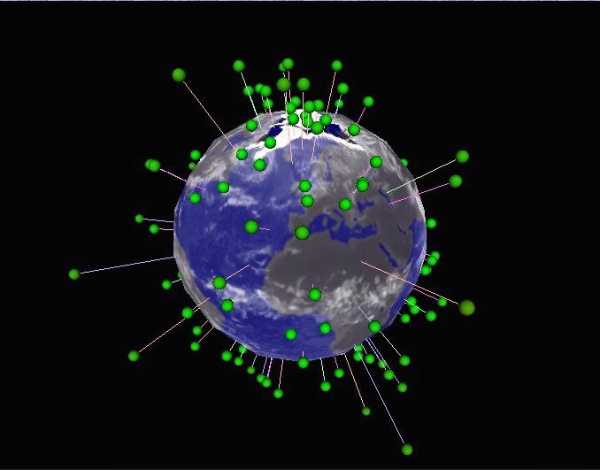
Figure 2: The geographic display where each remote server maps to its geographic location
The third representation handles those servers that are located at a central location (for instance at a main facility or central processing station). In this case, we represented two buildings with simplified models as seen in Figure 3. The Flodar system represents each server at its physical location in the building by cylinders. In this case, we have chosen to represent the volume of traffic with the radius of the cylinder - timeliness is represented by transparency. Those servers which have not signalled grow more opaque, while those which report in become more transparent. This again gives visual weight to those servers which a traffic monitor should be investigating in greater detail.
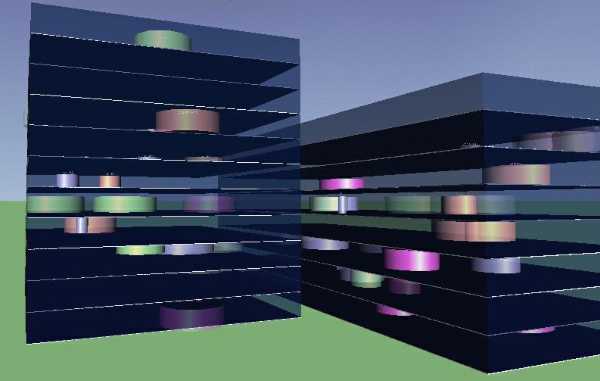
Figure 3: Building Display with servers shown at their locations in a central facility
All three visualizations use preset viewpoints which allow the traffic monitors to quickly view areas and situations of interest. The global display has viewpoints over geographic regions, while the building display provides viewpoints at each building. The platter display provides several default viewing angles as well. All three visualizations provide a consistent interface for the traffic monitors to selectively display the different categories of servers.
The FLODAR system also provides hyperlinks from the representation of each server to another display showing the traffic flow to or from the individual server, as seen in Figure 4. This display is created from the database, and indicates where the traffic flows. In this fashion, the volume on the links between the servers can be easily displayed, and a traffic monitor can readily query a server for more information.
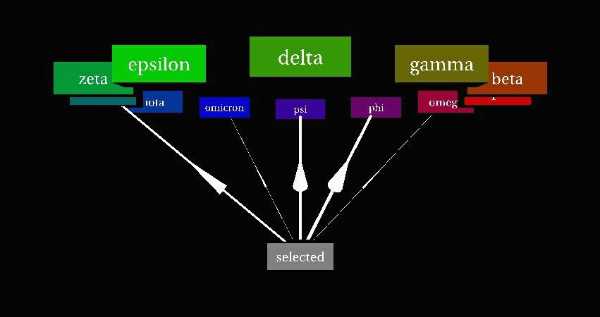
Figure 4: Generated display of network traffic flowing from selected server to a set of processing servers.
These visualizations have several advantages over the traditional Network Traffic Flow displays. Traditional displays are usually based upon the topology of the network, potentially resulting in confusing or poorly-laid out visualizations. Work by Eick and others [1-4] add a geographic representation to the visual display, yet still primarily display a network topology as the main display methodology. However, a human traffic monitor would need to visually scan the network display on a periodic basis, examining each node or link. While these displays prove useful for monitoring the traffic along the links of a network, they are not as useful for monitoring node-based activity - such as the load on a hub of a network - because most of the visual space is made up of the link-based topology. The FLODAR display removes the traditional topological display in favor of physically representing the nodes of the network. The link information can easily be added as an additional in-depth display, but is less important to the traffic monitor. With the FLODAR platter display, the traffic monitor can easily discern whether a problem exists at a glance - even from across a room.
We created all of Flodar's visual displays from Virtual Reality Modeling Language (VRML) 2.0. Multiple traffic monitors from diverse locations may need to observe the same system, and possibly collaborate to solve problems. Therefore, we have developed the system with interactive web techniques. We used nearly isomorphic VRML prototypes to represent the servers in the displays, which helped expedite the development considerably.
Java drives the displays, and provides events and updates to the VRML displays. The External Authoring Interface (EAI) is used to communicate with the VRML world and browser. The Java code, using the Java Remote Methods Interface, also polls the database where the actual accounting of the servers occurs. At regular intervals, the underlying Java application queries the database for a current status. The database resides on a remote server and tracks the actual communications with the remote servers. After the database returns a list of updates, the Java application updates the display by sending events into the VRML browser.
Since we built the entire system with Web-based technology, traffic monitors at remote sites can also access the FLODAR display. To add additional components to the FLODAR system simply requires adding a new hyperlink to the proper component. This, when combined with the rapid development allowed with the isomorphic VRML prototypes, proved to be an ideal setting for rapid iterative prototyping. Eventual users suggesting alternative displays or components.
Early in the development, we tested several alternate displays. For the platter, the initial design placed the servers which were most current at the center, and the node representations marched outward over time, with no other difference. However, we changed this approach to the current display because it showed all of the properly functioning servers in a jumble in the center of the display, while the larger perimeter was sparsely populated with those servers requiring more attention.
We also tested the geographic display on a two-dimensional map. The display was not as useful or attractive to the users of the system. Because the tethers were all in parallel, it hampered the 'at-a-glance' analysis of the display. Also, it was more difficult to visualize both the relative value and an accurate location on the map simultaneously. While a flat map does provide a display of the entire surface, adding a slow rotation to the VRML globe is trivial and provides the same utility.
Users of the FLODAR system find the interface an easy one to learn and use. The platter display remains the most popular among the traffic monitors. The traffic monitors only use the secondary globe and building views for specific tasks. In the future, we expect to provide links from the display to the specific servers being observed - perhaps opening a collaborative session with a site manager for diagnostic purposes, or displaying another Web-based status display for a particular server.
While we designed the FLODAR application specifically for monitoring message traffic on a computer network, the visualization techniques are general enough to easily extend to other applications. Plus, the VRML interface contains no domain knowledge at all. We are currently evaluating using the platter display for other monitoring situations. We are also extending both the web-based interactivity and the visual displays to adapt and extend to other challenges.